Data View Window
The LABO Data Viewer window provides a real-time view of all data collected while running the Experience. From this window, you can monitor events, Responses, participant behaviour (e.g., body tracking data, eye tracking data), variable updates, data streams and much more! It's a powerful visualization tool to see the highly dimensional data collected with LABO, offering immediate insights and analytics into your Experience and the participant's behaviour.

Event-Point Data

Event-Point Data
In this section of the Data Viewer, you can see all the Events and Actions data in real-time. It is essentially a log of all the different Actions occurring throughout the Experience and the different Responses which are triggered on each action (e.g., triggering an audio when a participant clicks a button, updating a Variable based on participant input).
The table imitates the structure of the EventResponsesData.csv, which stores all the Event and Actions data. To learn more about this data and what each column represents, visit this page.
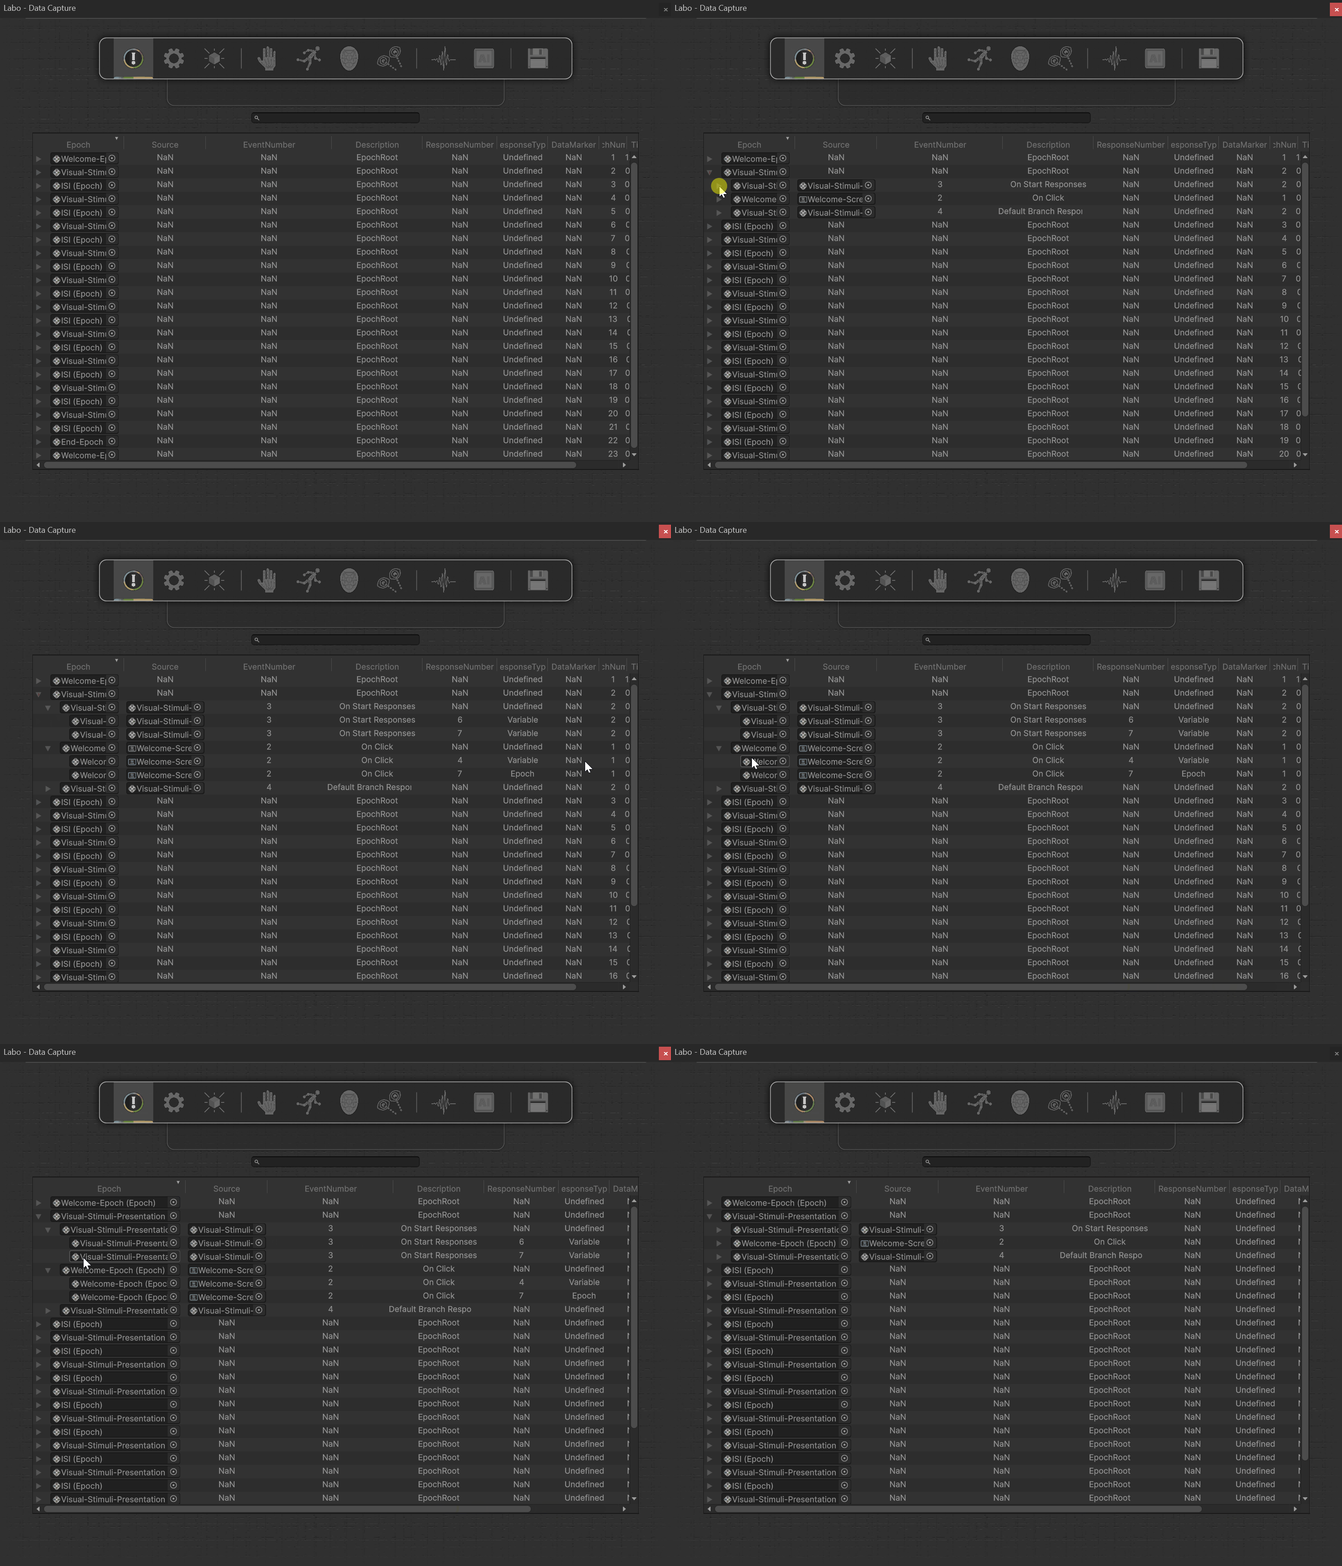
The data is organized by Epochs. Whenever an Event occurs or an Action is triggered during an Epoch, an entry appears in the table with all its related data. You can find this data neatly organized under dropdowns for each Epoch.
Event-Points

Rows
Data is organized by Epoch, so you'll need to expand an Epoch to view its specific data. Once expanded, you'll see the Actions and Events that occurred during that Epoch.
This structure also helps you visualize the flow of your Experience, showing the order in which each Epoch occurred. For example, in the view above, you can see a repeating cycle of Visual-Stimulus-Presentation Epochs (where stimuli are shown to participants) followed by ISI (Inter-Stimulus Interval) Epochs.